

Smart home
[Loading..]
📐 Floor plan
📜 Historical
Loading climate history…
🏗️ How it works
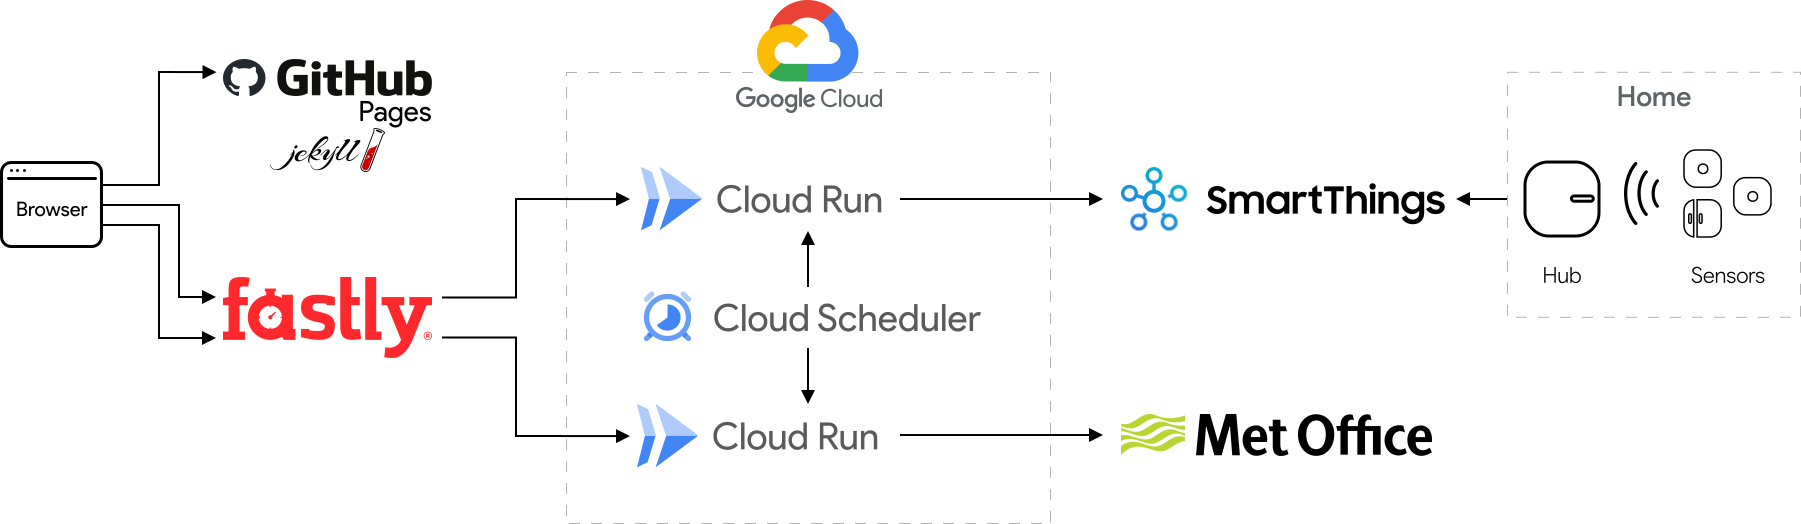
This page is a static site built with Jekyll, whose JavaScript pulls two live feeds - indoor climate and outdoor weather - and renders them in your browser. Every reading is also archived to a shared database, which powers the historical chart above. Here's what sits behind each.
Delivery and caching
- A static site, hosted free on GitHub Pages. On load it fetches each feed through the Fastly CDN, which caches every response at the edge and forwards only misses to the Cloud Run functions behind it.
- Fastly serves the cached copy instantly; when it expires it refreshes in the background - so nobody waits - and falls back to the last good copy if an upstream is briefly down.
- A fresh fetch is slow (a cold start, an OAuth handshake and a walk over every device), so a pair of Cloud Scheduler jobs re-request each feed on a schedule - the indoor climate every few minutes, the slower-moving weather less often - keeping the cache warm even when nobody's around. Each table notes when its data was last updated.
- The CDN, scheduling and access control are all defined as code with Terraform, and credentials live in Google Secret Manager rather than in any code.
Indoor climate, from Samsung SmartThings
- Walks every device in our Samsung SmartThings account, keeps the ones reporting temperature or humidity, resolves each one's room, flags readings older than 24 hours as stale, and sorts them by name.
- Reaches SmartThings over OAuth 2.0, refreshing a short-lived access token from a long-lived refresh token it stores - and rotates - in a database, so the feed keeps working with no manual re-authentication.
- This page averages the readings itself, both overall and per room.
- On each origin refresh it also appends the latest reading to a shared database, building the climate history the chart above is drawn from.
Outdoor weather, from the Met Office
- Calls the Met Office Weather DataHub (Site-Specific) API for our local forecast.
- Normalises the response - the weather type, temperature and how it feels, humidity, chance of precipitation, wind speed, gust and direction, dew point, pressure, UV index and visibility - into the compact JSON this page renders.
- Like the indoor feed, each origin refresh appends its reading to the same shared database for the historical chart.
Historical climate, the chart above
- Both live functions append every reading they fetch to a shared Cloud SQL (MySQL) database - one append-only table per source.
- A third Cloud Run function serves the chart: for the window you pick (last day through last 12 months) it runs a grouped min/max query per source, buckets the readings into UTC hours or days, merges the inside and outside sides into one row per bucket, and returns them as JSON - edge-cached for an hour like the live feeds.
- The database entities and the shared read/write logic live in one package, so they are not copied between the functions that share the database.
Source code
Each of the moving parts above lives in its own repository:
- christianbrown.uk - the Jekyll source for this site, including the page you're reading.
- terraform-fastly-christianbrownuk - Terraform that defines the Fastly CDN configuration in front of the Cloud Run functions.
- cloud-run-function-smartthings-climate-php - the Cloud Run function that serves the indoor climate data.
- cloud-run-function-met-office-weather-php - the Cloud Run function that serves the outdoor weather forecast.
- cloud-run-function-historical-climate-data-php - the Cloud Run function that aggregates and serves the historical climate data behind the chart.
- smartthings-api-sdk-php - PHP client for the Samsung SmartThings API.
- met-office-weather-datahub-api-sdk-php - PHP client for the Met Office Weather DataHub API.
- cloud-run-function-lib-php - shared helpers for running the PHP Cloud Run functions.
- api-client-php - the underlying HTTP API client library the above build on.
- oauth2-client-php - PHP OAuth 2.0 client that keeps the SmartThings access token fresh via the refresh-token grant.
- christianbrown-database-orm-php - shared Doctrine ORM entities and the climate read/write logic for the Cloud SQL database the functions share.
- key-value-store-php - PHP key-value store used to persist those OAuth tokens in the database.